[ Insights Campaign ]
Communicating your knowledge shouldn't require heroics
We build the system that makes your charts, infographics and data visuals consistently trustworthy and on-brand, regardless of who is making them.
3-5X
Faster chart production after we built a chart UI kit and token-based system for Block.
+300%
Engagement with data stories after Moody's released our identity and standards.
16.5M
Raised after we developed a data visualization identity and demo for a startup.
More importantly than any of these numbers, these teams have something they built together. A shared language for what good looks like, and the confidence to keep going without us.
The teams we work with are usually at an inflection point: a rebrand, a new head of design, a funding round where trustworthiness is no longer an option. They've been producing research, reports, and dashboards for years. The gap is between the quality of their thinking and the quality of how it shows up.


.webp)
What should you build?
We shape every system around your brand, your tools, and the people doing the work. We scope what yours needs, build it with you, and make sure it runs without us.
Dataviz maturity audit
Data visualization visual identity
Data visualization style guide and Infographics guidelines
Data Visualization Color System
Chart Templates (Figma, PPT, Datawrapper, Flourish, Excel, Illustrator..)
Design System for Data Visualization
Chart Component Library (D3.js, React/Svelte)
Data visualization Workshops

We find out where you are at
We audit the charts and interview the people who make and approve them. We come back with a locked roadmap for what to build.

We build the foundation
A visual language grounded in your brand: colors, type, layout logic, and the principles that justify every chart decision. Plus a governance model that keeps the system alive.

We deploy the system
We embed on live work, team by team, and leave each team with the standards and templates to keep going independently.
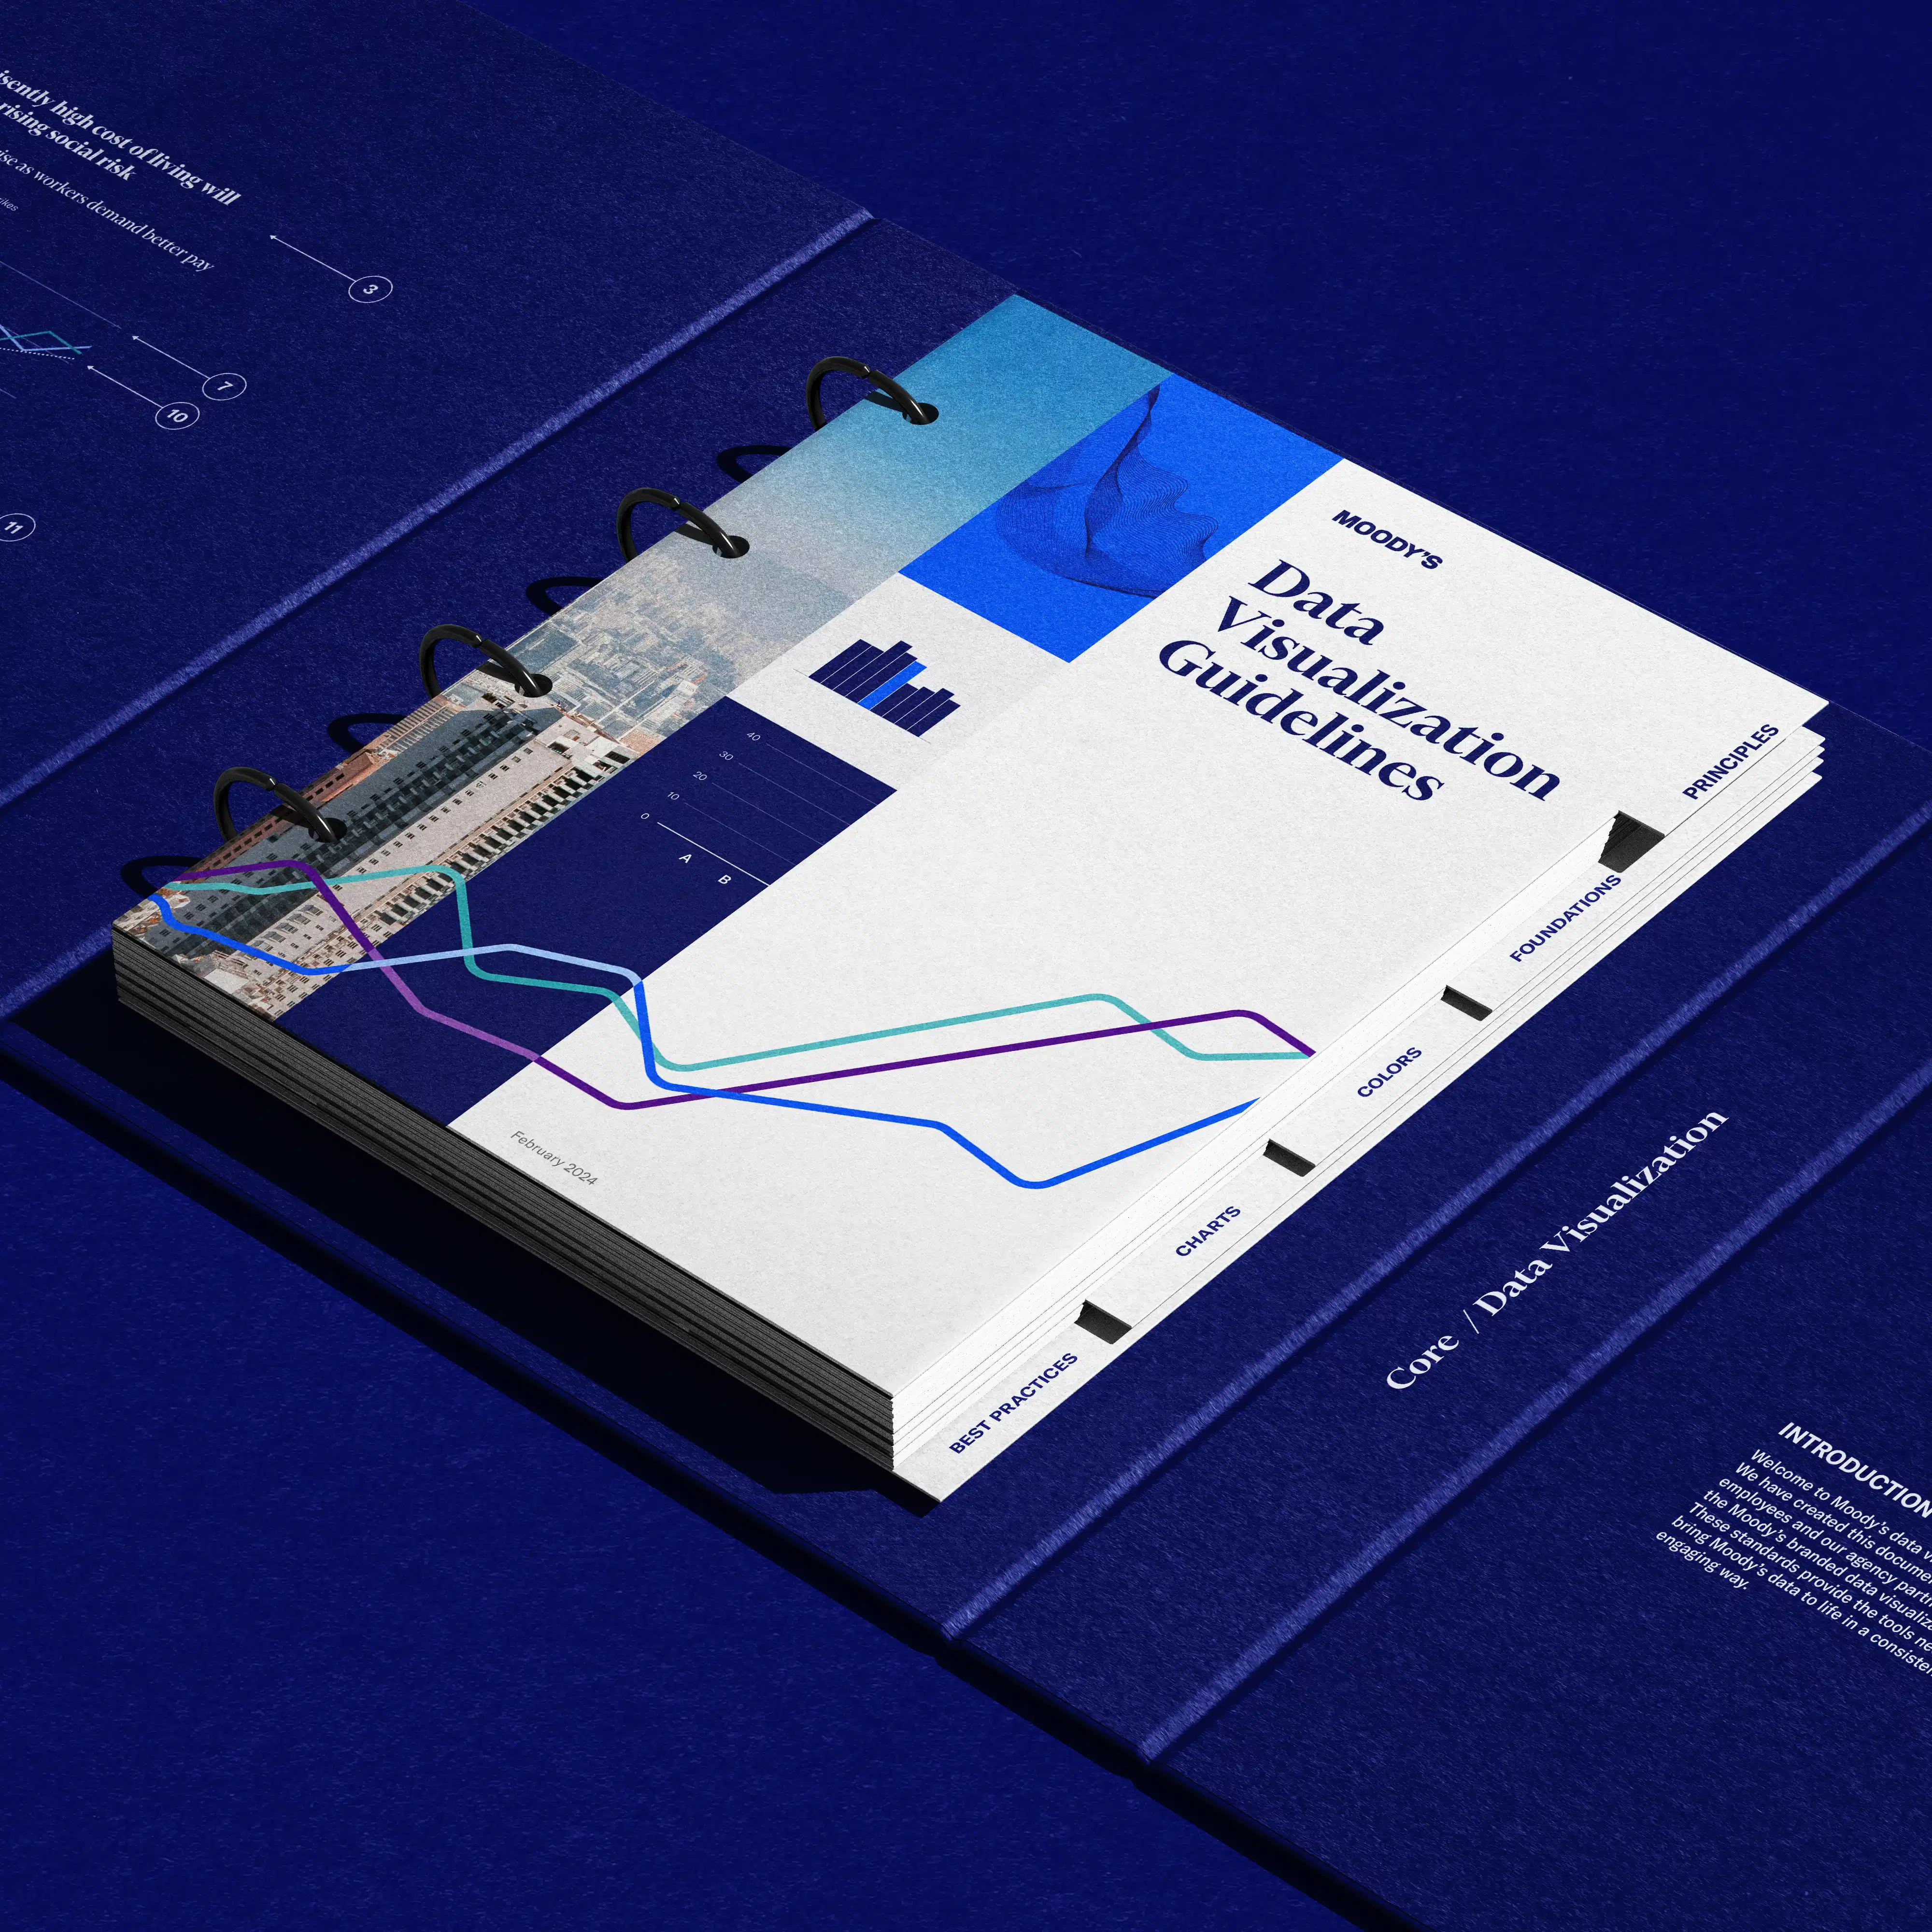
The transition to our new branded data visualization system has been extraordinary, and well-received by internal stakeholders and external audiences. Adoption across the business has been tremendously successful. From data stories to infographics to social media data viz assets, the visual consistency has been monumental — and the new system wonderfully captures our company’s core principles.
—Todd Lindeman, VP of Data Visualization at Moody's

Data Visualization Systems Buy-In Deck
Do you find yourself making the case for a dataviz system, over and over, to people who aren't quite there yet? This deck gives you something to put in the room. We built it to help champions make the case internally: what a system is, why it matters, and what it takes to build one that actually gets used. Bring it to a lunch and learn or a one-on-one with the person who needs convincing.